

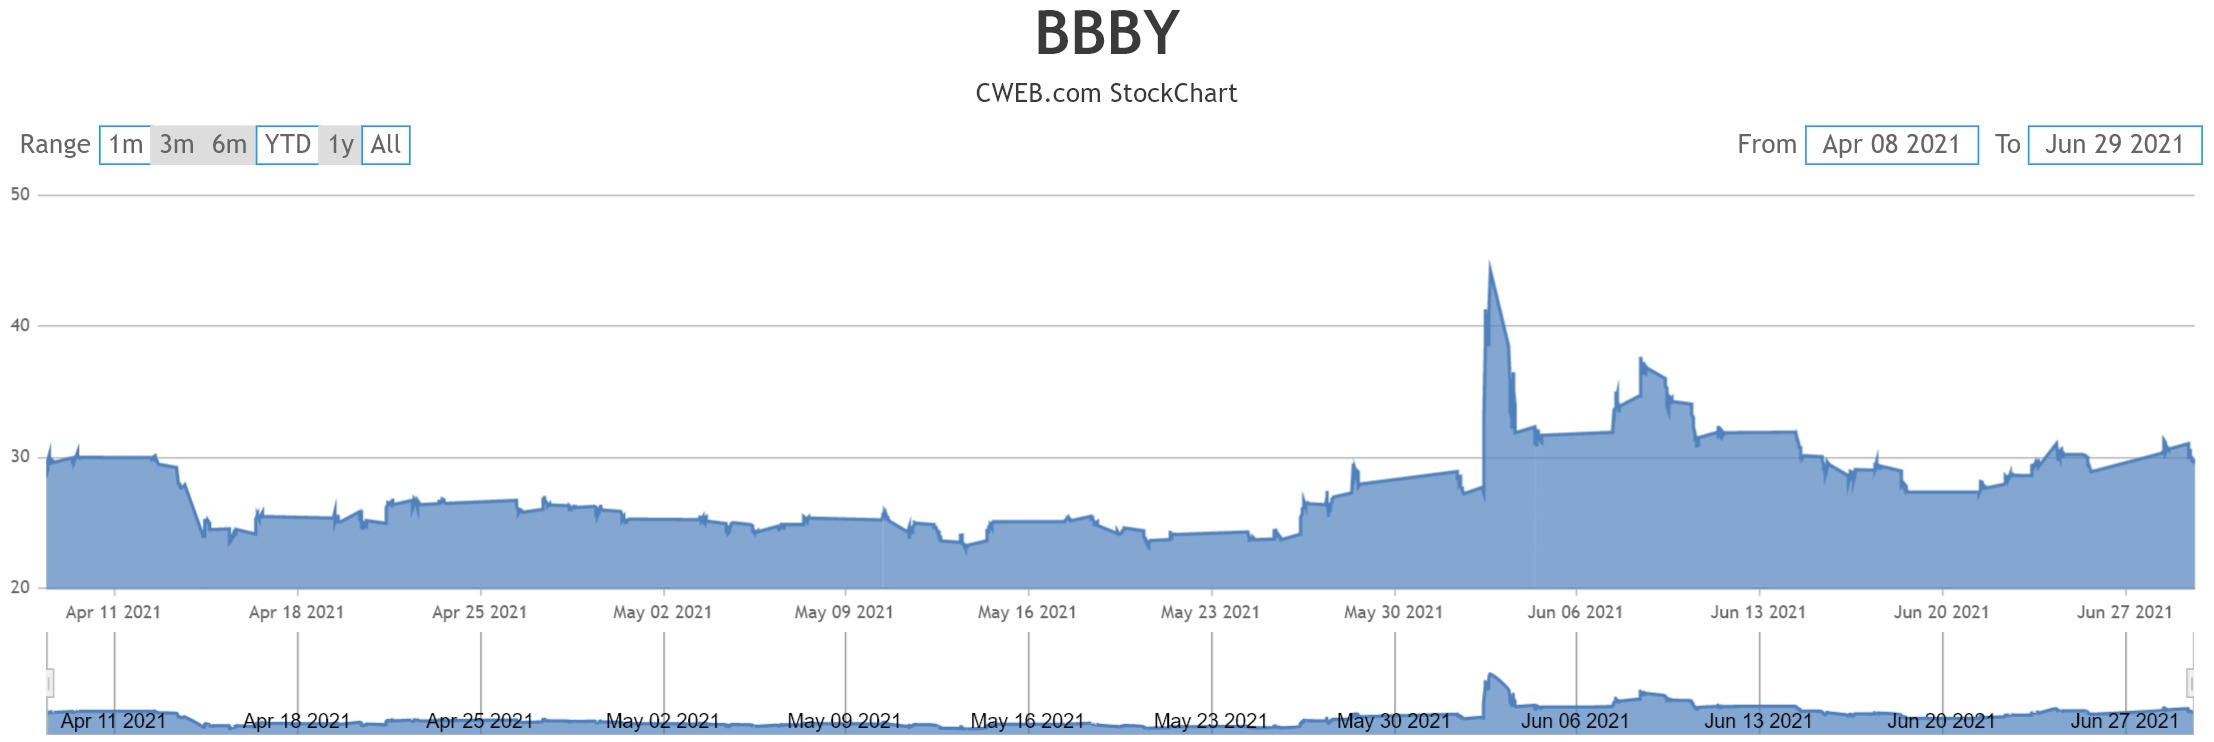
Bed Bath & Beyond Inc. (NASDAQ: BBBY) today reported financial results for the first quarter of fiscal 2021 ended May 29, 2021.
- Core1 Sales growth of +73%; Comparable3 Sales growth of +86% versus Q1 2020
- Comparable Sales growth for Total Enterprise +3% compared to Q1 2019
- Gross Margin of 32.4% and Adjusted2 Gross Margin of 34.9%, primarily driven by Owned Brand launches and channel mix shift due to normalized digital penetration versus the COVID-19 period last year
- Q1 Adjusted2 EBITDA of $86 million inclusive of incremental marketing investments during the quarter
- Establishes guidance outlook for 2021 second quarter
- Raises full fiscal year 2021 guidance outlook on Sales and Adjusted2 EBITDA; Re-establishes Adjusted EPS guidance
Fiscal 2021 First Quarter Results (March-April-May)
- Net sales were $1.95 billion, reflecting Core1 banner sales growth of 73% compared to the prior year period. Net sales growth versus last year was primarily driven by an increase in Bed Bath & Beyond banner sales.
- Net sales included planned reductions of 24% from non-core banner divestitures.
- Comparable3 sales increased 86% compared to the prior year period, which excludes the impact of the Company’s fleet optimization activity. Compared to 2019 fiscal first quarter, total enterprise comparable sales increased 3%, driven by digital sales growth of 84%.
- Comparable3 sales included an estimated 13% impact from fleet optimization activity when compared to the fiscal 2020 first quarter.
- Bed Bath & Beyond banner sales increased 96% compared to the prior year period as the Company had a significant number of stores closed during the 2020 fiscal first quarter at the onset of the COVID-19 pandemic.
- Bed Bath & Beyond banner sales were driven by growth in its key destination categories, which includes Bedding, Bath, Kitchen Food Prep, Indoor Decor and Home Organization. In total, these categories delivered strong sales growth of more than 100% compared to the 2020 fiscal first quarter and growth of 7% on a comparable sales basis versus the 2019 fiscal first quarter. These categories represented approximately two-thirds of total Bed Bath & Beyond banner sales in the first quarter.
- The buybuy BABY banner continued to deliver positive sales growth with net sales increasing more than 20% compared to the 2020 fiscal first quarter, and an increase of low-single digits on a comparable sales basis versus the 2019 fiscal first quarter. Comparable sales were driven by more than 50% growth in digital.
- Gross margin was 32.4% for the quarter. Excluding special items from both periods, adjusted2 gross margin increased 820 basis points to 34.9%, primarily driven by a favorable product mix from Owned Brand launches as well as a more normalized mix of digital sales coupled with a strong recovery in store sales growth.
- SG&A expense, on both a GAAP and adjusted basis, decreased significantly compared to the prior year period, primarily due to cost reductions including divestitures of non-core assets and lower rent and occupancy expenses on more efficient stores. This was partially offset by incremental marketing investments to support the Company’s “Home, Happier” campaign as well as the initial launches of the Company’s Owned Brands.
- Adjusted2 EBITDA for the period improved to $86 million compared to last year, primarily due to higher sales and adjusted2 gross margin expansion, which were partially offset by incremental marketing investments to support the Company’s “Home, Happier” campaign as well as the initial launches of the Company’s Owned Brands.
- Net loss per diluted share of $0.48 includes approximately $56 million from special items. Excluding special items, adjusted2 net earnings per diluted share was $0.05. Special items reflect charges such as non-cash impairments related to certain store-level assets and tradenames, loss on sale of businesses, loss on the extinguishment of debt, and charges recorded in connection with the Company’s restructuring and transformation initiatives. Restructuring and transformation initiatives includes accelerated markdowns and inventory reserves related to the planned assortment transition to Owned Brands and costs associated with store closures related to the Company’s fleet optimization, and the income tax impact of these items.
- As expected, operating cash flow usage of $28 million was in-line with historical first quarter seasonality and working capital needs. Accordingly, free cash flow5 was an investment of $102 million as a result of $74 million of planned capital expenditures in connection with store remodels, supply chain and IT systems.
- Inventory reduced by approximately $110 million compared to the end of fiscal 2020, was primarily related to seasonal selling and product transitions in preparation for the introduction of the Company’s Owned Brands, as well as store closures related to the Company’s fleet optimization activity.
- $130 million in capital return to shareholders through share repurchases.
- Cash, cash equivalents, restricted cash and investments balance were approximately $1.2 billion.
- Total Liquidity4 was approximately $1.9 billion, including the Company’s asset based revolving credit facility.
CWEB Analyst’s have initiated a BUY Rating for Bed Bath & Beyond Inc. (NASDAQ: BBBY) and price target of $39 by end of 2021. The Company now expects higher fiscal year 2021 Net Sales of $8.2 billion to $8.4 billion from $8.0 billion to $8.2 billion. The Company is raising comparable sales expectations for the second through fourth quarters of fiscal 2021 to the Low-Single Digit growth range versus its previously communicated guidance outlook for Flat comparable sales growth. This compares to the Company’s robust sales performance during the second through fourth quarters of fiscal 2020.
Click Here For Full Stock Research on Bed Bath & Beyond Inc. by CWEB.com
 today reported financial results for the first quarter of fiscal 2021 ended May 29, 2021.Core1 Sales gr)